BETA NOTE: Currently this website includes new instructional materials and limited geospatial information. As we develop more geospatial contextual variables like temperature, soil, livelihood zones we will keep adding to the list. Please email user support with any suggestions ipums@umn.edu
Geospatial Contextual Data
Contextual data describe features of the physical and social environment of a geographic area. These data can be linked to IPUMS-International geography variables in the microdata, allowing users to explore how contextual factors interrelate with individual characteristics and outcomes. For example, researchers can explore how ecoregion characteristics differentially affect household economic status or investigate the association between unusual precipitation events and migration patterns. In the following links, IPUMS provides some sources of contextual data.
Ecoregion
Ecoregion data deliniate descrete regions of similar geology, vegetation type, climatic zone, and species variation. Ecoregion data are static and do not change with time.
Precipitation
Precipitation data can be directly observed, modeled, or a combination of both and are provided at multiple spatial and temporal scales.
Working with geospatial contextual Data
Geospatial contextual data come in two forms: data summarized to geographic units (vector data polygons) and raster data that offer information on arbitrary grid-cells measured in meters or kilometers. In both cases, a researcher must use the IPUMS shapefiles in a GIS framework to connect the contextual data to the spatial coordinates of the administrative units identified in the IPUMS microdata.
Raster (grid-cell) data: users must summarize the raster data to the administrative geographies in the IPUMS data.
Vector (polygon) data: users must equate the spatial units in the summary data to those in the IPUMS microdata. This may involve aggregating the units in one source or another (or both) to yield spatially comparable units in the two sources.
The exact process of combining IPUMS microdata with contextual data will vary depending on the geospatial data source and the chosen software. Example notebooks detailing the process of combining IPUMS microdata with ecoregion and precipitation data using Python are available in the links above.
IPUMS Geography Variables
IPUMS provides geography variables at the first and second administrative level for most samples, with some offering the third administrative level. More information on IPUMS geography variables can be found here. Users can browse a list of all available geographic variables and can download corresponding GIS shapefiles from the boundary file download page.
Time Variant vs. Time Invariant Geospatial Data
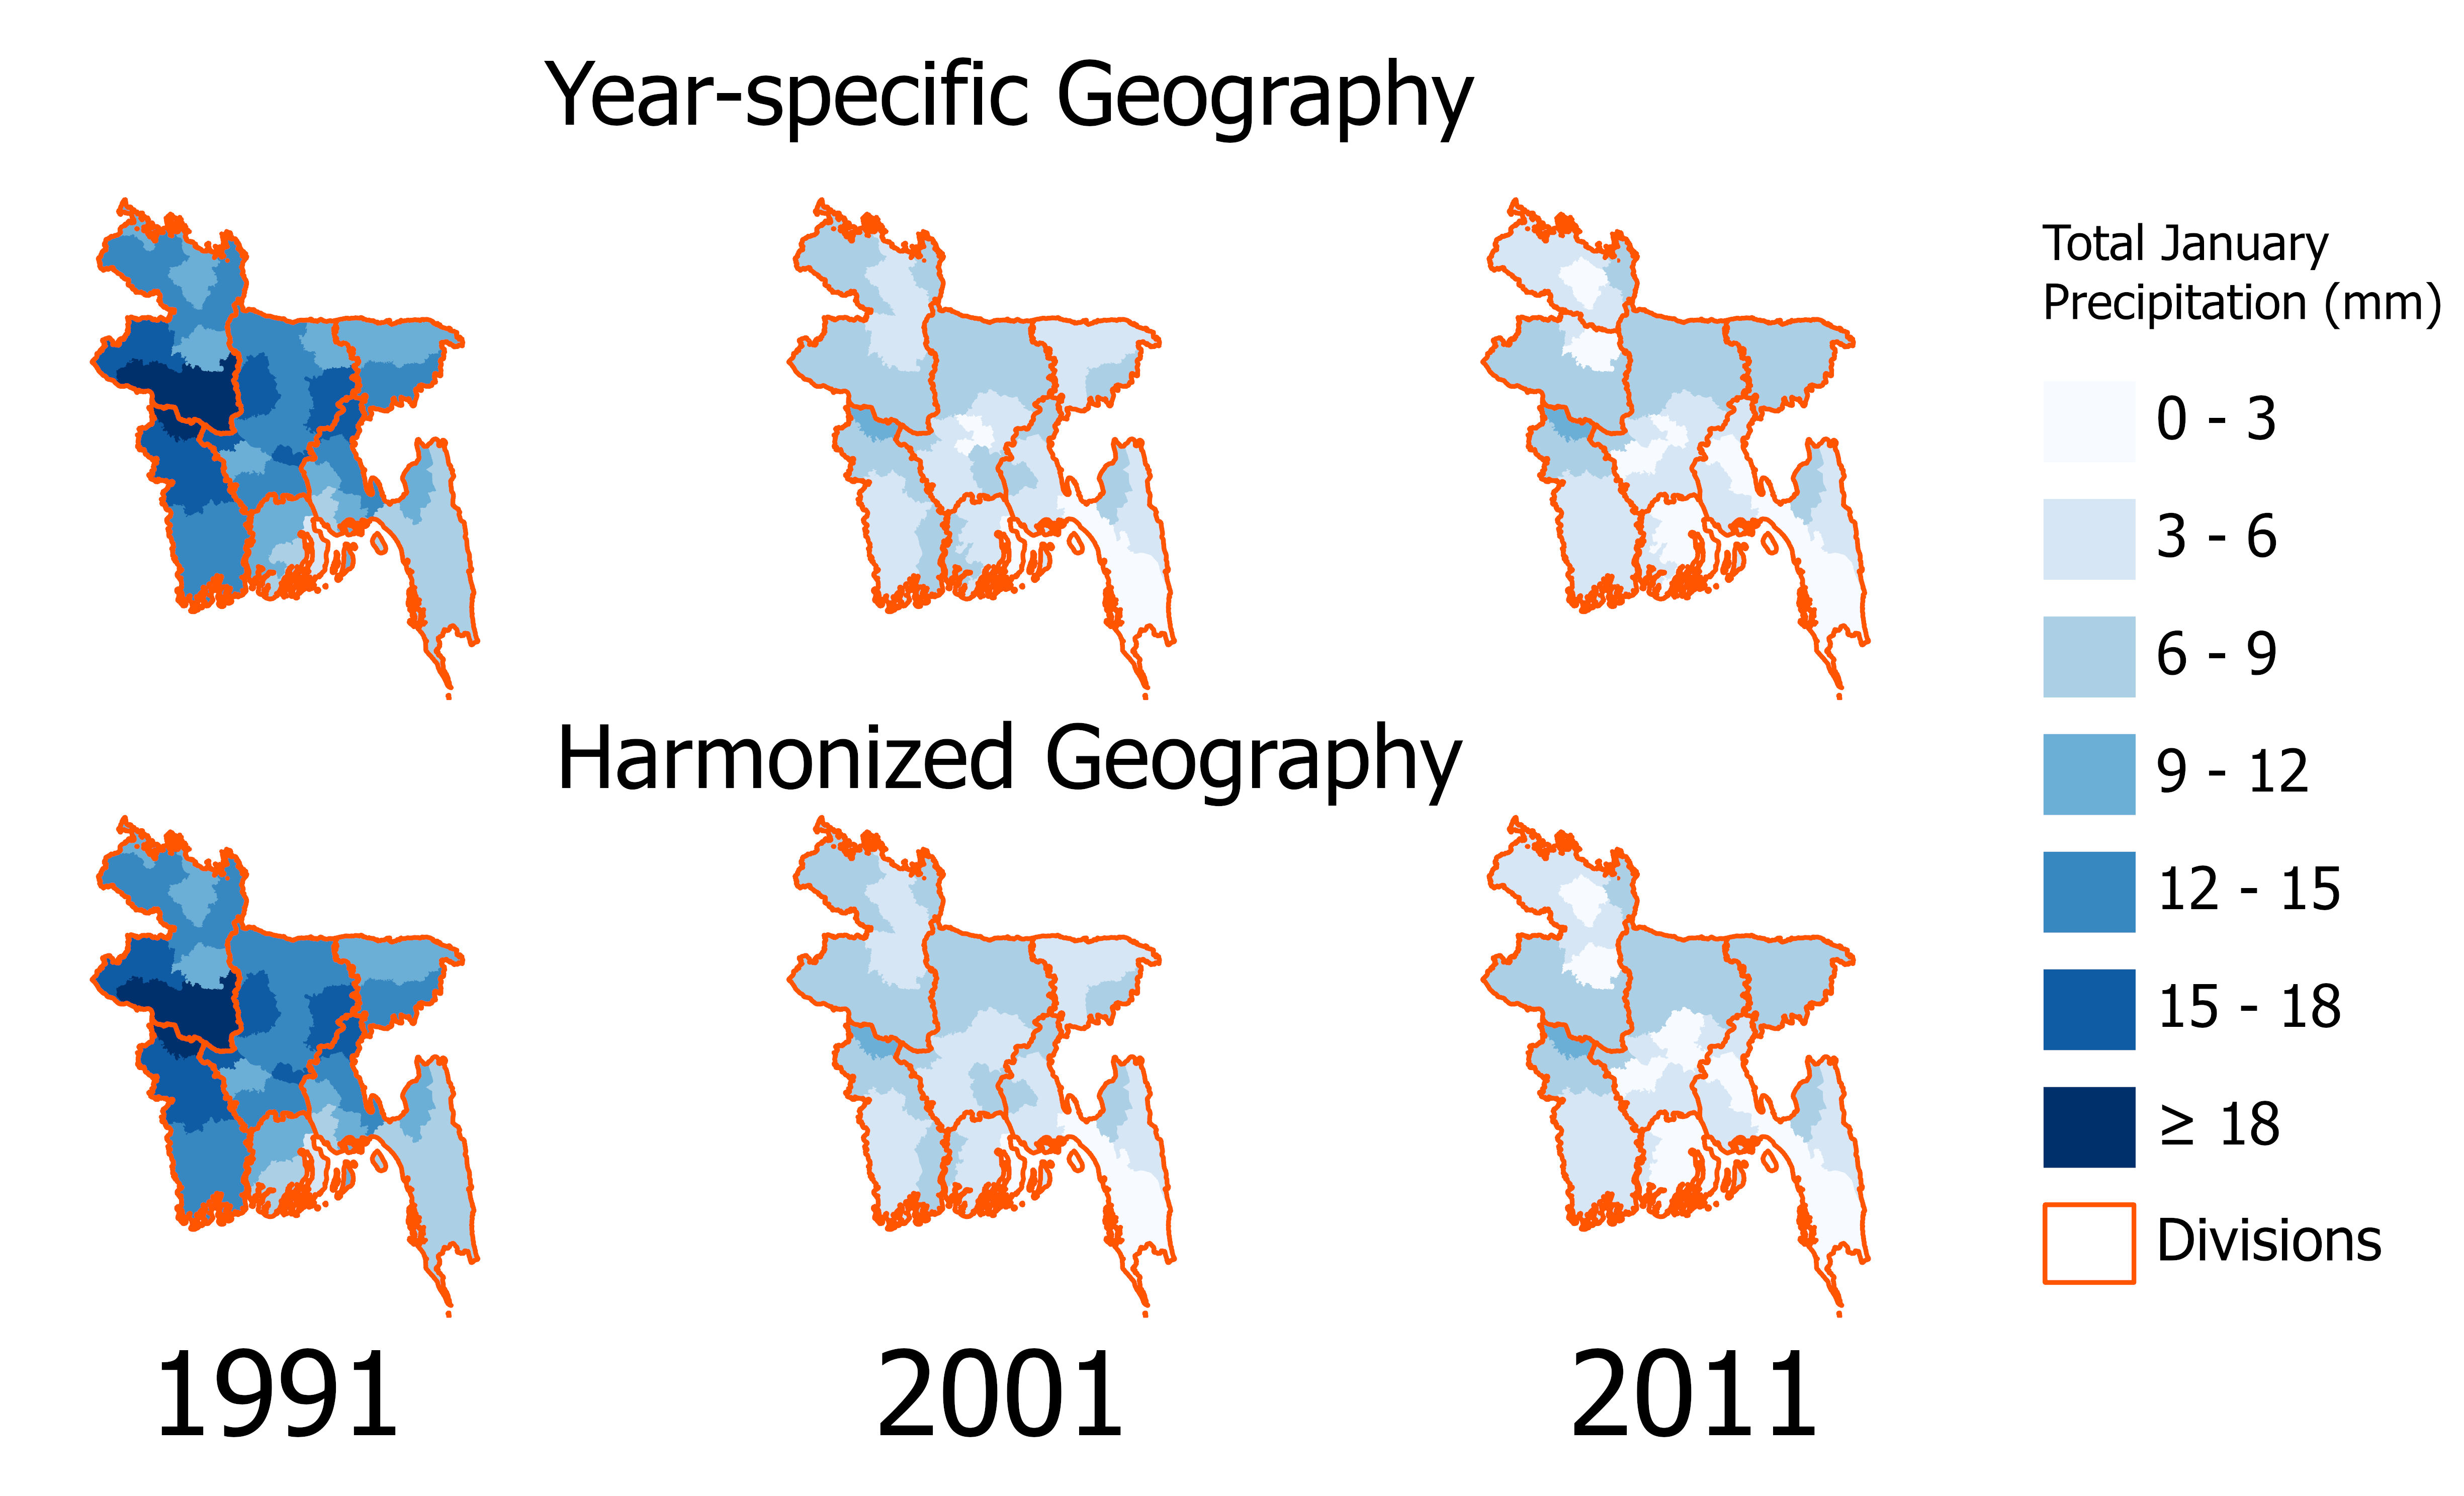
IPUMS International provides both year-specific and spatio-temporally harmonized geography variables. This allows users to explore both time invariant geospatial data like ecoregion and time variant data like precipitation. It is important to consider the nature of the contextual variable of interest. Harmonized geography can be particularly useful for combining microdata with time-variant contextual data because it provides consistent spatial footprints across time.
In the example below, note boundary changes between 2001 and 2011 in the northwest part of Bangladesh. Harmonized geography would be useful to study changes in January precipitation from 1991 to 2011, since they use a consistent footprint whereas year-specific geography could be used to study January precipitation for any given year.
Spatial Resolution
Contexual data sources do not follow administrative boundaries, so it is important to consider the spatial resolution of the IPUMS geography variable selected. More disaggregated geography variables capture the full breadth of contextual data variations more accurately.
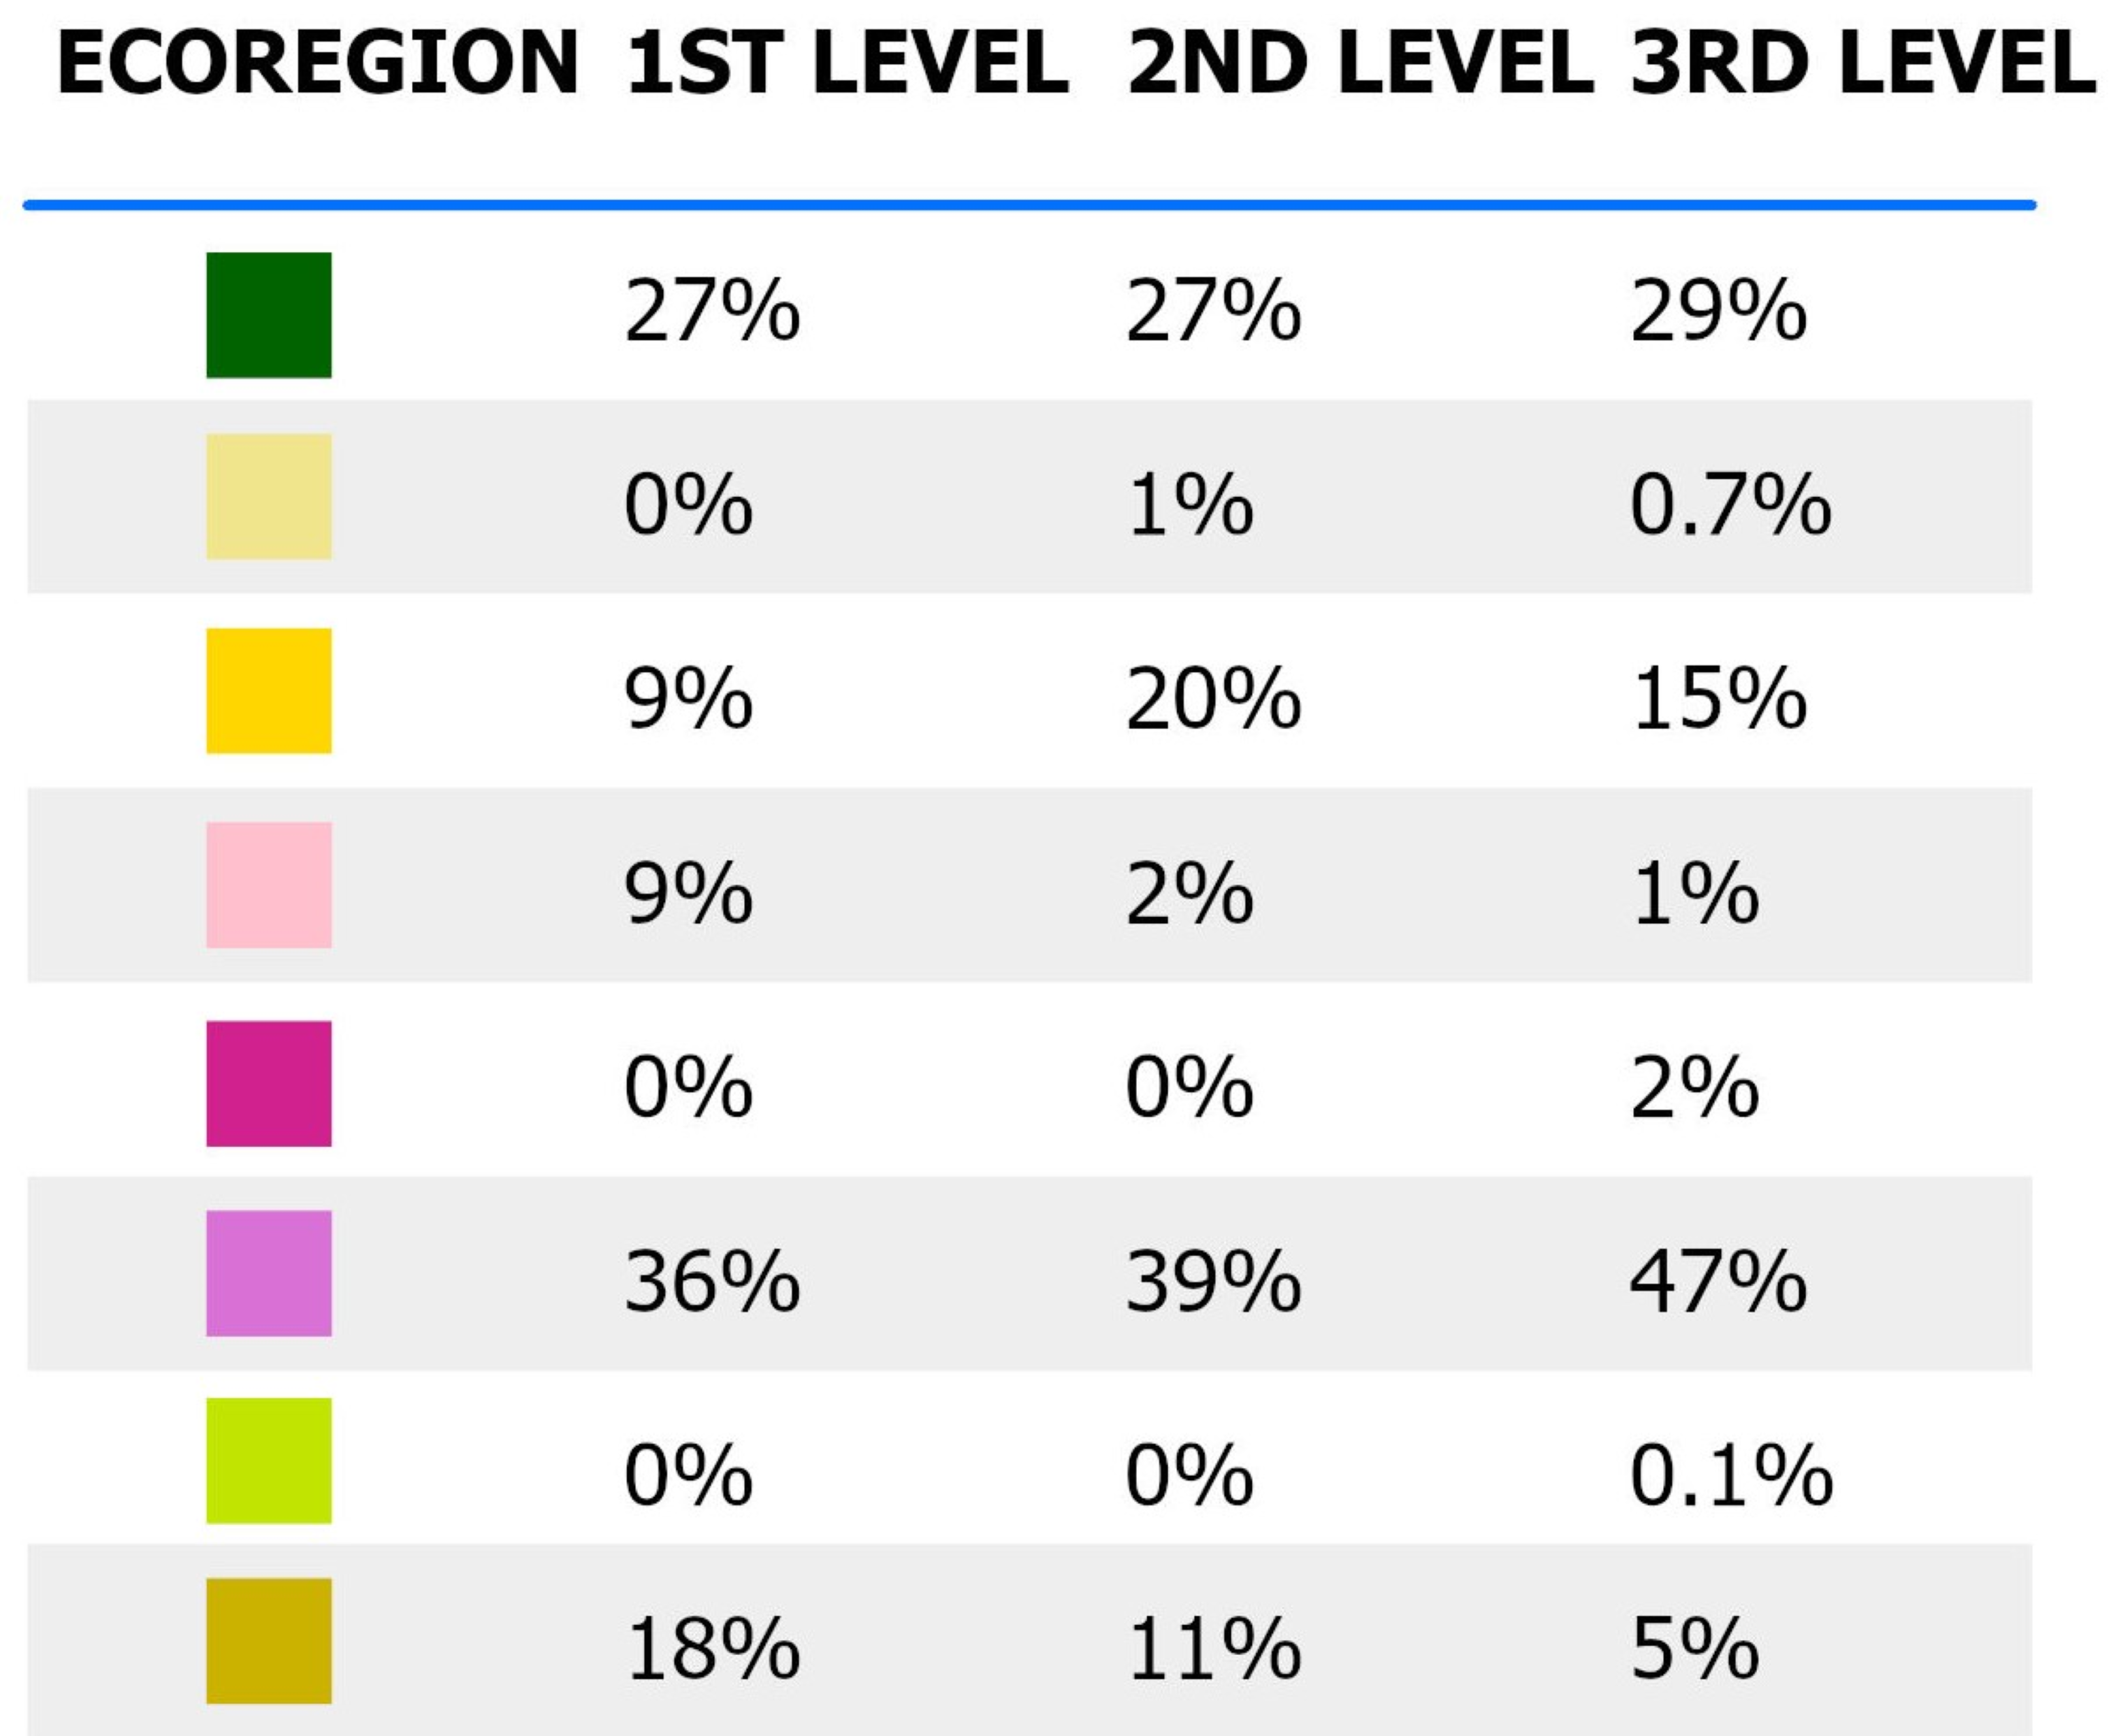
In the example below, first, second, and third administrative boundary levels for the Ethiopia 2007 sample are shown overlaid on top of the Ecoregion shapefile. The corresponding table shows the percentages of each administrative unit with different dominant ecoregions. In this example, accuracy increases with greater disaggregation.
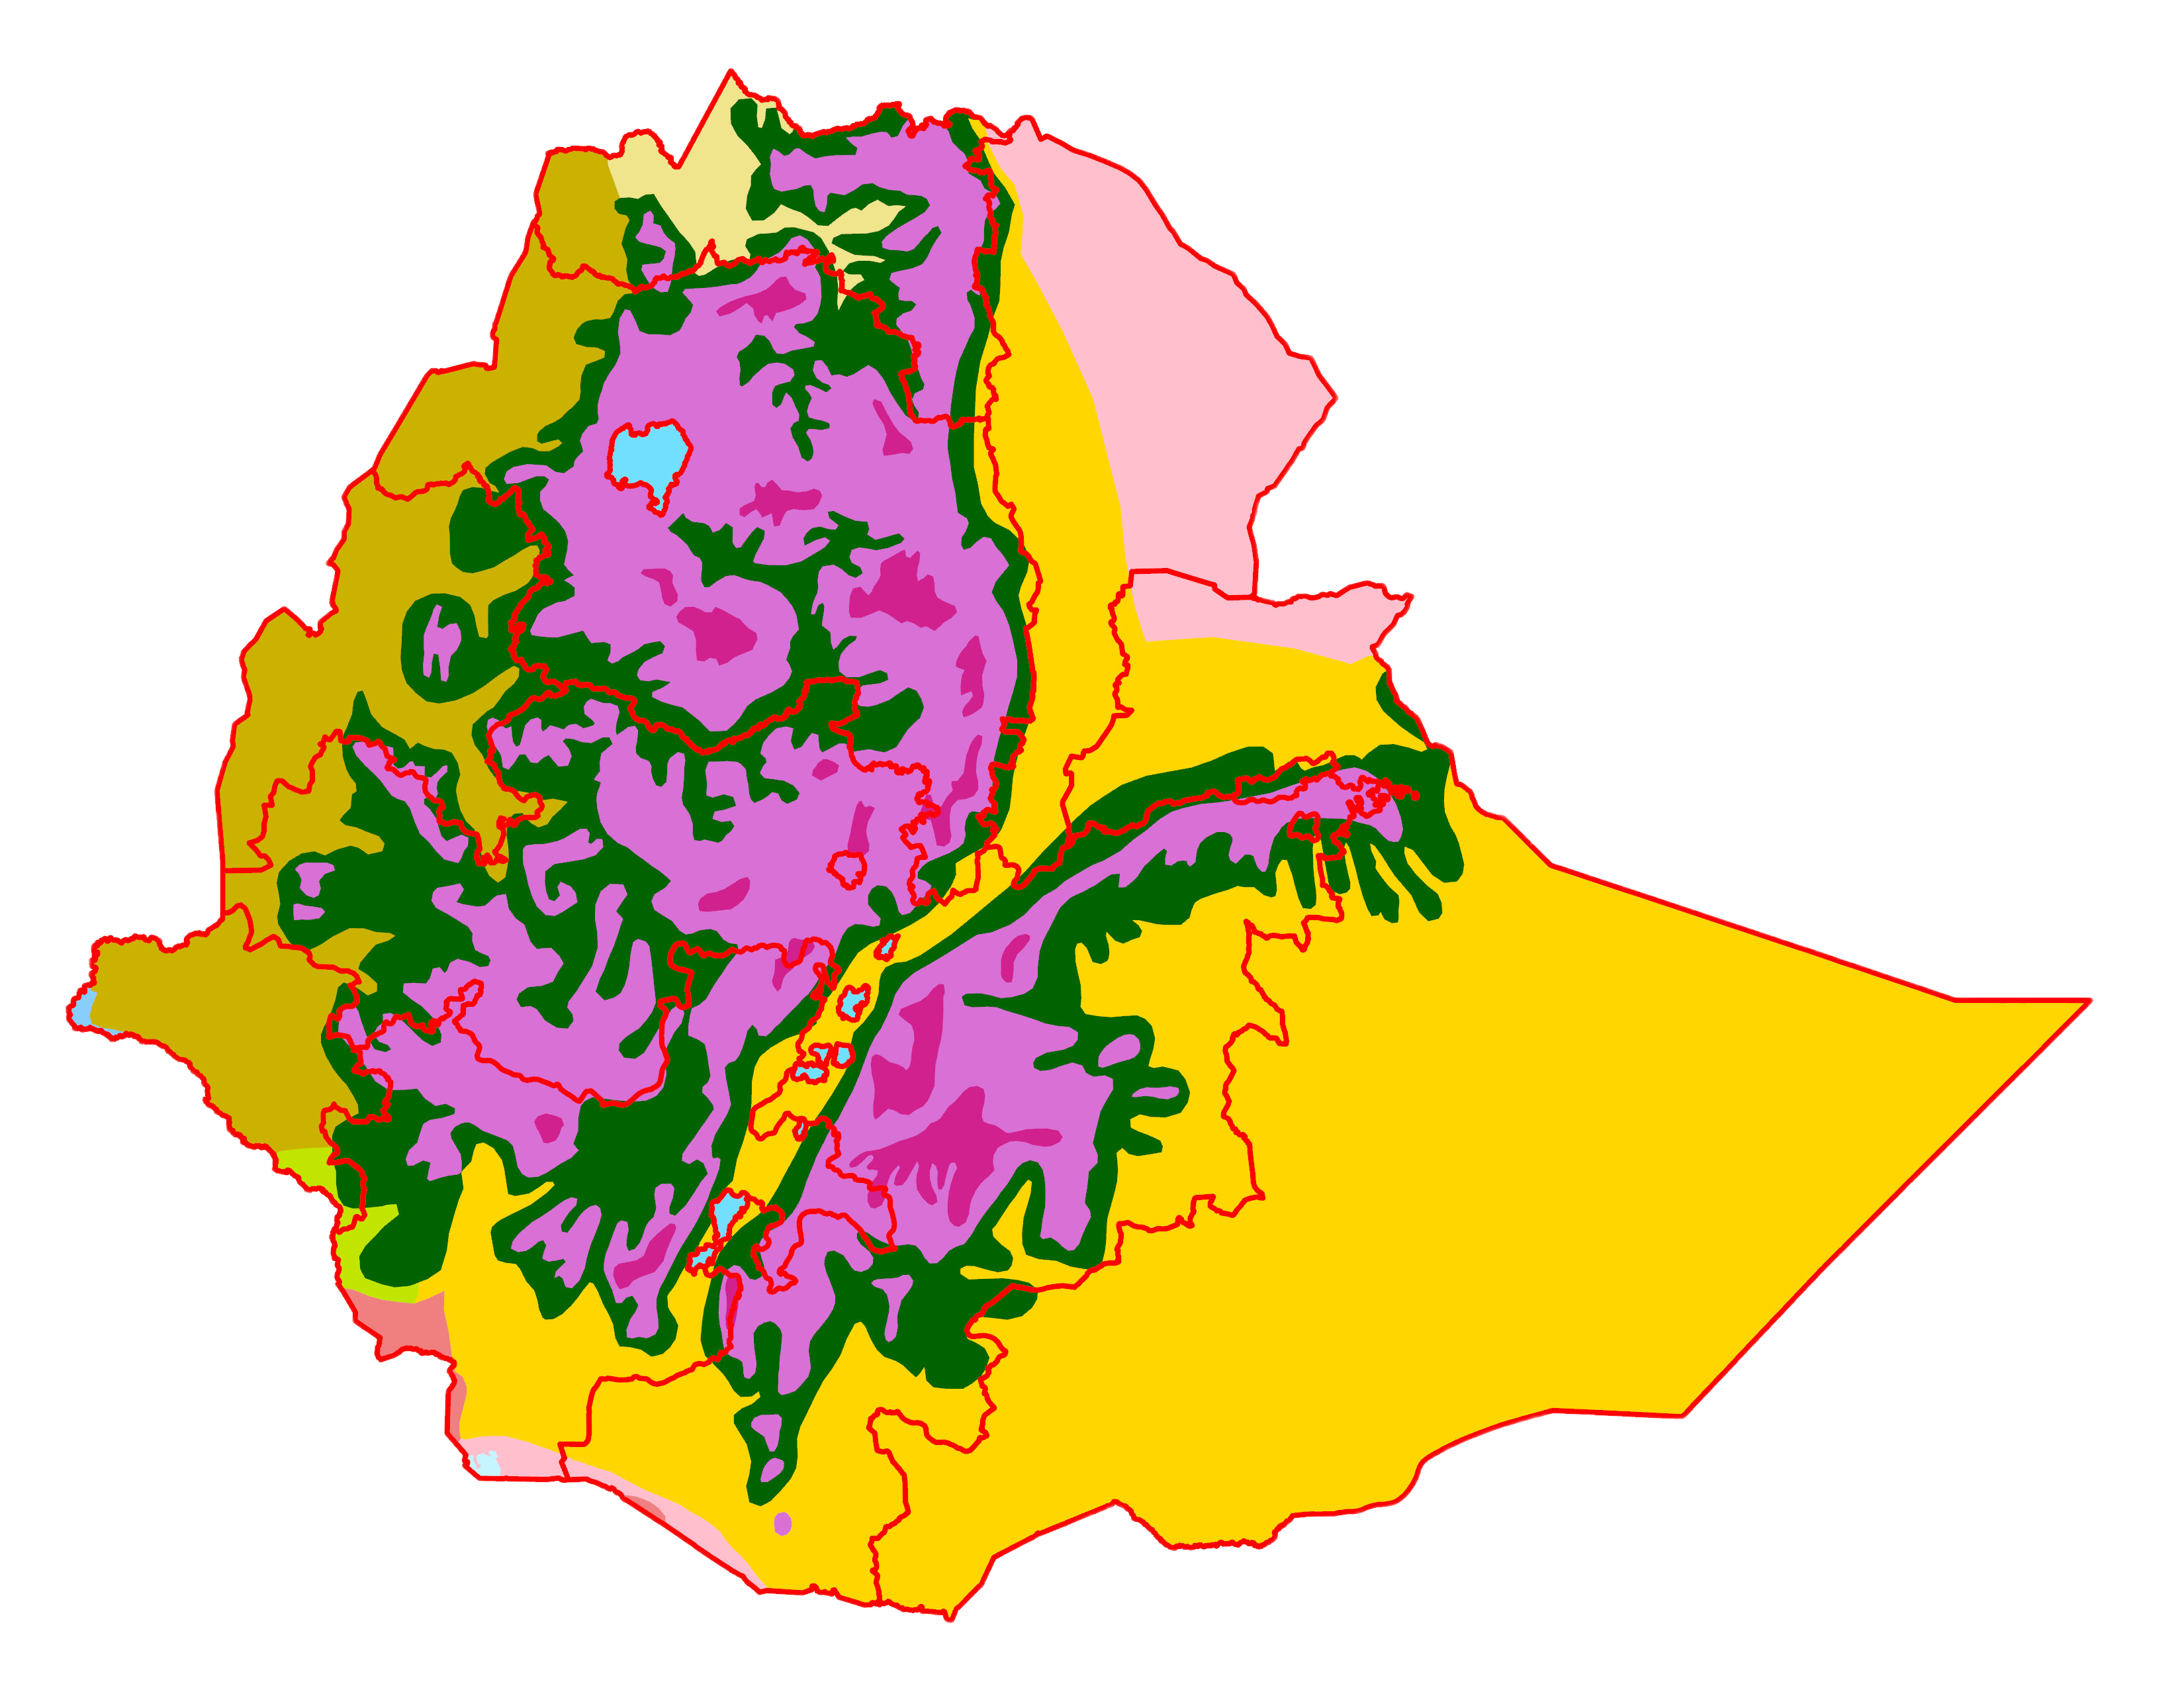
2007 First Admin level
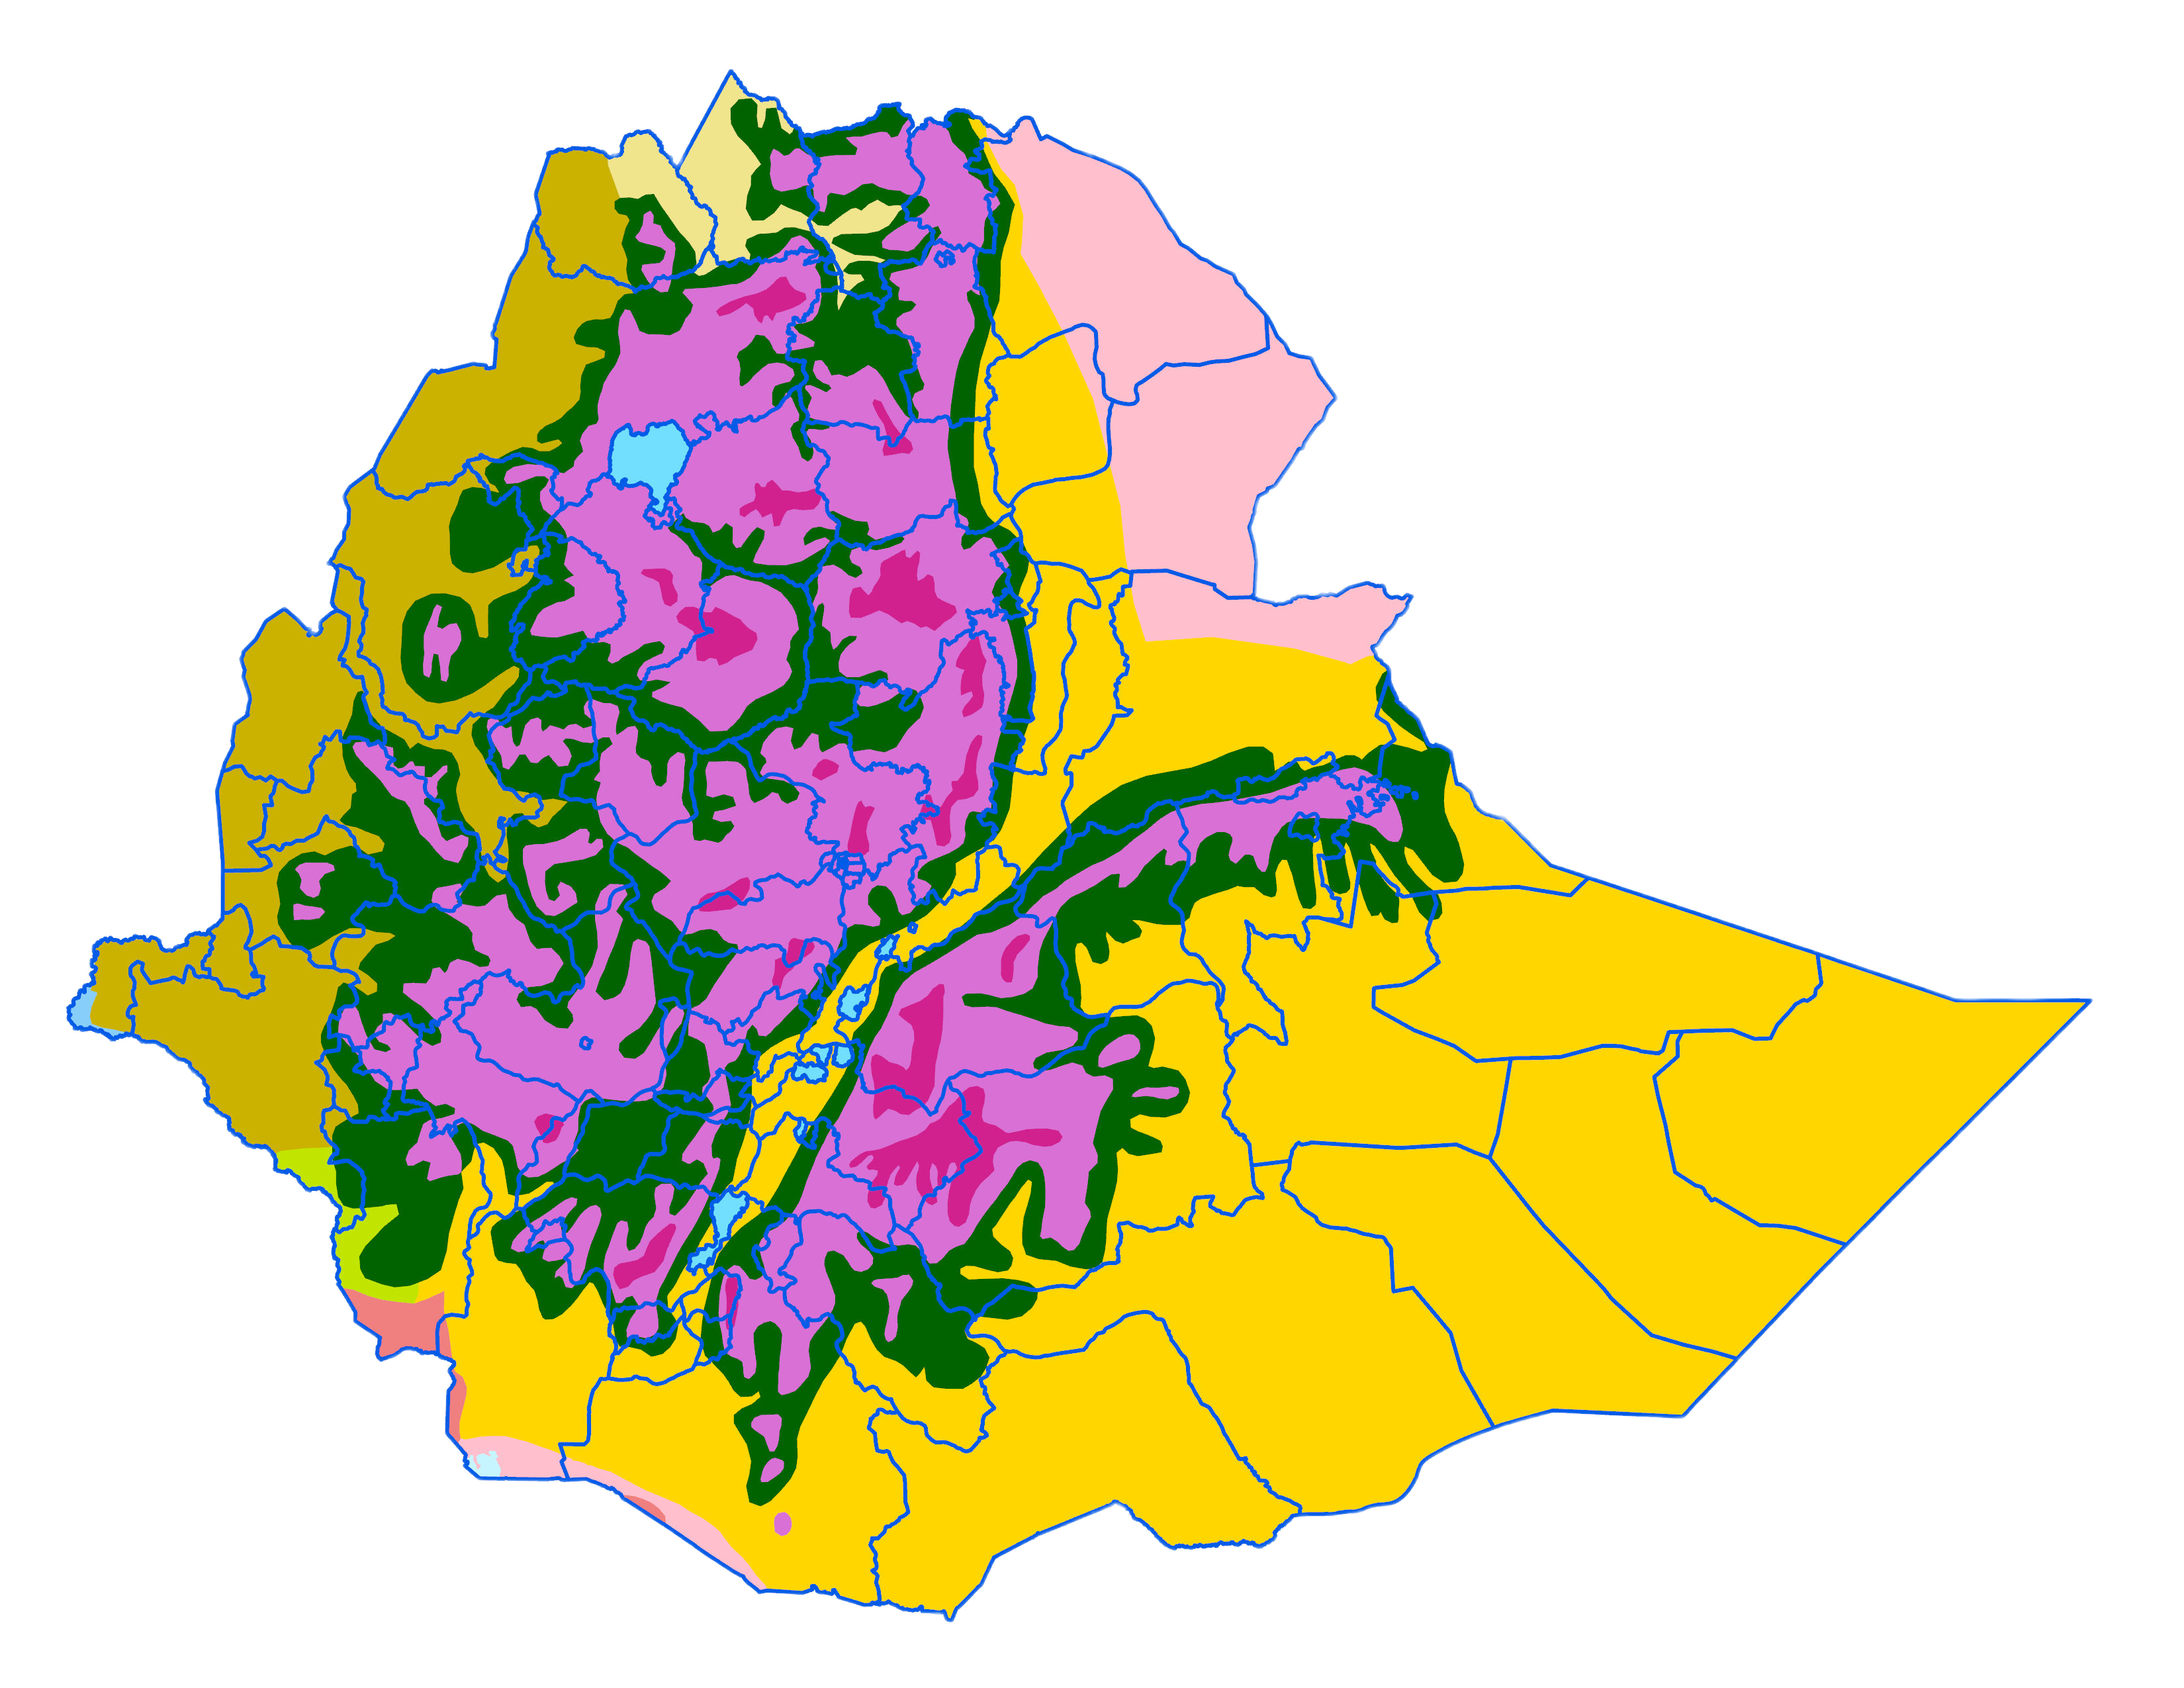
2007 Second Admin level

2007 Third Admin level
Supported By
![]()
![]()
![]()
![]()